
What we'll cover
Share with your community!


Get Free Consultation

Tableau vs Power BI: Best AI Analytics Tool Compared in 2026
 David N. Wilks
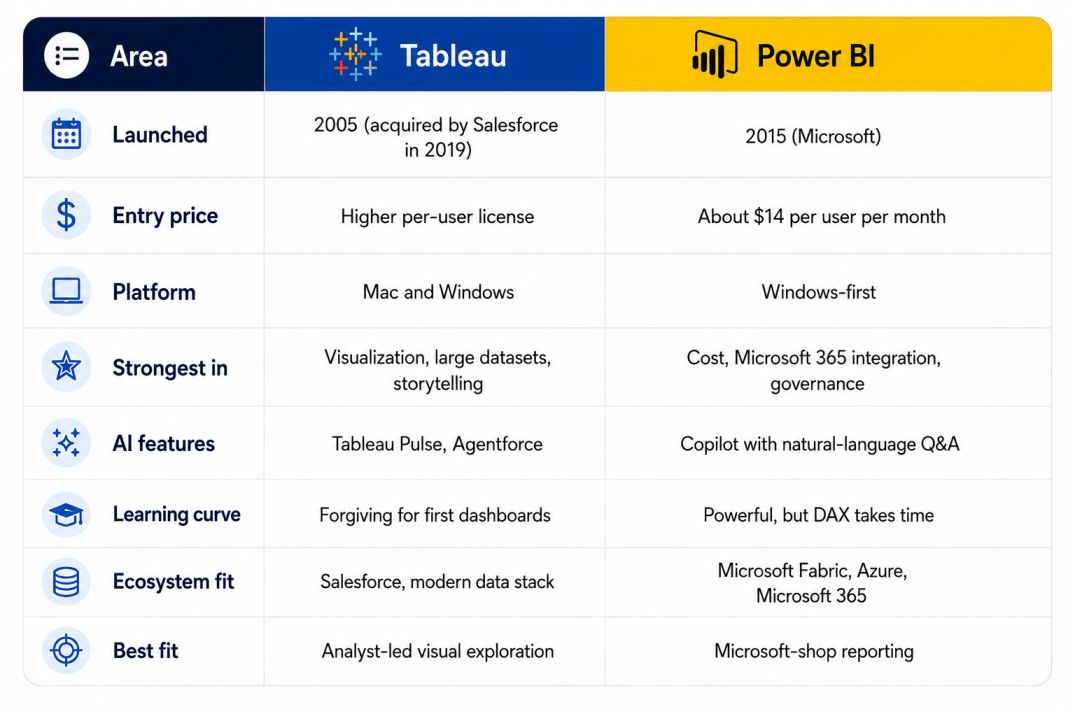
Over ten years now, Tableau and Power BI have swapped first place in business intelligence tools; choosing between them remains a frequent challenge for leaders. By 2026, it matters less if charts look polished. What counts is your existing tech setup, spending limits, plus how fast your people move from messy data to clear choices. Put simply, Power BI has an edge in price and works smoothly within Microsoft systems, whereas Tableau offers richer visuals and greater freedom in layout. One isn’t always superior.
Here’s a breakdown comparing both platforms by artificial intelligence abilities, speed, interface design, expenses, and compatibility with company setups to help organizations large or small find what fits their analytic needs.
The Analytics Scene in 2026
The picture is different now. Static reports are fading out, and smart systems highlight odd numbers before you notice them. Tools don’t wait anymore; they speak up when something shifts. One trend stands clear: answering fast matters more than building charts by hand. Behind every quick insight, the system has already learned what counts. Both Tableau and Power BI chase speed, not just display but understanding, so a question asked plainly comes back as a clear answer, with the machine doing the digging first and people stepping in later.
Here’s another big factor: where your data already lives. Firms using Microsoft Fabric, Azure, or Microsoft 365 tend to go with Power BI up front. Meanwhile, outfits built around Salesforce Data Cloud plus newer data setups usually land on Tableau. Many of these same teams also run their pipeline data through an AI CRM software layer before it ever reaches a dashboard. So the Tableau vs Power BI choice is less about which screen looks better and more about what your company already runs, top to bottom.
Tableau vs Power BI Compared Simply
Power BI in 2026
What started as a simple reporting tool now fits right into Microsoft’s full lineup. Alongside Excel, Teams, Power Automate, Azure, and Fabric lakehouses, it connects without friction, especially if your workplace runs on Microsoft already. Finance or ops staff find their spreadsheets turn neatly into structured data sets. Dashboards move across Microsoft 365 while access rules stay clear via Azure controls. A real free version exists for desktop work. Built-in intelligence comes ready thanks to Copilot, adding smarts without extra steps. Price stays low even as features grow.
Tableau in 2026
Still top of the line for seeing patterns and telling stories with data, Tableau puts visuals at the center. Built to let users sketch, tweak, and shape insights fast, its layout invites quick cycles of trial. Following the Salesforce takeover, links deepened between Tableau and tools like Data Cloud along with CRM Analytics. That tight fit makes it a go-to for groups focused on clients or boosting income streams. In fields such as data science, advisory services, marketing analysis, or product tracking, its adaptability suits exploratory tasks that lean into creative formatting. It works just fine on either Mac or Windows machines, an edge where tech setups mix different systems.
Comparing Copilot and Pulse AI Features
What stands out most in the Tableau vs Power BI comparison? Artificial intelligence plays a key role, and each tool handles it in its own way. One leans on subtle guidance, while the other builds smarts into the workflow.
One way to start is with a basic ask, like showing sales and profit trends across products, regions, and months, and Power BI Copilot builds an entire report page from that. Visuals appear based on what makes sense for the data. Alongside them, short explanations form in plain language. Even custom calculations, like DAX measures, get suggested without manual entry. Time spent setting up early drafts drops because of this flow. By 2026, it stands out among built-in AI tools inside analytics platforms. However, using all features might need more robust Microsoft Fabric resources.
Pulse by Tableau puts metrics first, staying ahead of shifts before they pile up. Watched numbers get scanned nonstop, odd jumps trigger alerts, and explanations follow close behind, all packed into updates sent straight to the apps teams use daily. Under Salesforce’s AI umbrella, Agentforce handles smarter, independent analysis tasks. Here’s how it breaks down: one tool helps you build faster, the other sends findings without waiting. You ask a question in plain language and a chart comes back, so each fits a different rhythm in how people engage with data.
Performance and Data Handling
One platform works one way, the other takes a different path, and the Tableau vs Power BI gap shows clearly in how they handle data. When it comes to big data, Power BI skips full imports using Direct Lake inside Microsoft Fabric, so reports pull straight from lakehouse files, and updates feel almost live, which is especially useful for tracking things like deliveries or financial risks. Tableau leans into speed by refining how its Hyper Engine reads pre-built summaries, helping analysts dig deep across countless angles quickly. Heavier statistical work, the kind typically handled by an AI data science platform upstream, still gets handed off to these BI tools for the final reporting layer. Most times, Power BI delivers dashboards fast. Still, when work means untangling scattered data across clouds, folks often see Tableau coping better
Design and Customization
Built differently, Power BI uses structured blocks that stay consistent across large groups working together. Rather than fixed layouts, Tableau allows fine control over layout details, type choices, and interactive behaviors ideal for polished presentations meant for executives or wider audiences. In practice, the decision comes down to priorities: tight alignment in regulated settings pushes users to Power BI; striking imagery aimed at impact usually finds a home in Tableau.
How Each Tool Saves Time
Here’s what matters most: getting from curiosity to a choice faster, and one way these tools help is by cutting out extra steps. Inside Microsoft setups, Power BI speeds things up, since you can ask something in normal words and get a report right away, no middle person needed. Tableau, on the other hand, shines when someone who knows data well wants to dig in. Instead of typing queries, they drag, click, and see the connections appear, so answers pop up not because they were asked directly but because the visuals lead there. Leaders find less time lost chasing information with either tool, while delays fade as teams stop waiting for analyst-built reports. Some of that speed comes from dashboards plugging directly into AI workflow automation software, so an alert in Power BI or a Tableau Pulse update can trigger the next action automatically.
Pricing Comparison: Tableau vs Power BI
For just using licenses, Power BI costs much less, usually one-fifth of Tableau’s price per person. The desktop version sits on your machine at no charge, letting solo users build reports without spending a dime, and small groups gain the most here. A price increase moved Pro to $14 monthly per user by 2026, up from $10 before. When teams need wide sharing, they might hit limits unless premium tools or Fabric power kicks in. Big companies tend to cover those expenses within larger Microsoft deals already signed.
Priced by role, creator, explorer, or viewer, Tableau hits hardest at the top tier, outpacing Power BI Pro in individual cost. Because of this, each person using it carries a heavier tab, something tight budgets might pause over. Still, big organizations and academic institutions often absorb the hit without blinking. Look closely: Tableau tends to charge more up front per license. Yet when Power BI scales into heavy usage with premium backend needs, its total expense climbs fast, sometimes by six figures yearly. Guessing based on seat count alone misses too much. Real clarity comes from mapping actual use, not surface numbers.
Advantages and Drawbacks of Every Tool
Tableau Strengths and Weaknesses
Pros:
- Best-in-class visualization quality and design flexibility
- Strong performance on large and complex datasets
- Cross-platform support on both Mac and Windows
- Connected closely to Salesforce Data Cloud while working smoothly within today’s data systems
- Mature community with extensive learning resources
Cons:
- Price per person runs higher, particularly when users are making content
- Steeper learning curve for advanced features
- Slower onboarding for non-technical business users
- Native AI currently trails Power BI Copilot
Power BI Strengths and Weaknesses
Pros:
- The lowest entry price on the market, plus a no-cost desktop version that stays fully usable
- Works closely with Excel, Teams, Azure, and Microsoft Fabric, so operations run smoothly together
- Native AI tools built in with Copilot and question answering
- Simple model-level governance that keeps numbers consistent
- Fast monthly release cadence
Cons:
- Not quite as sleek at the top end, though the graphics still hold their own against Tableau’s finest
- DAX has a real learning curve
- Big companies pay more to store extra data, and fees climb fast when you need lots of space
- Non-Microsoft platforms often seem left out when working alongside Microsoft tools
Choosing by Scenario
Matching the tool to your needs makes sorting out Tableau vs Power BI straightforward. While one fits tighter into certain workflows, the other might slip better into different setups, depending on where you stand.
Start with Microsoft 365 and Azure? Then Power BI fits without extra effort. From raw data to live visuals, it flows smoothly through one system. Built-in help like Copilot shows up when needed, and cost stays low since the pieces already connect. Choosing another tool would mean adding steps.
Run on Salesforce and Snowflake? Start with Tableau. Tied tightly into Salesforce Data Cloud, it flows naturally through today’s cloud storage setups, and the smoother fit shows up in how things connect behind the scenes.
Need uniform, controlled reporting at scale? Power BI fits best. Built-in security at the data model level handles big user bases without breaking stride, so the structure stays consistent even as numbers climb into the thousands.
Digging into data patterns matters most? Start with Tableau. Its knack for shaping visuals works well for consultants, marketers, and even product teams, and flexibility in design helps tell stories without rigid templates getting in the way.
Most of the team isn’t tech-focused? Then Power BI makes more sense, since its interface reminds people of Excel. Because Copilot guides the steps, picking it up feels less overwhelming, and learning happens faster when tools seem familiar at first glance.
The Hybrid Reality
Some big companies go with Tableau and also bring in Power BI, picking one or the other depending on what task shows up. For example, a store chain could rely on Power BI to watch daily numbers live for many staff members at once, yet switch to Tableau when planning long-term moves or exploring complex data patterns behind decisions. Larger rollouts often coordinate this through AI project management software to track who owns which dashboard and when it gets reviewed. When you need wide-access reports plus expert analysis work, mixing both tools often just happens naturally after comparing what each does well.
Conclusion
Picking between Tableau vs Power BI in 2026 really hinges on just two clear things: which tech world your company already lives in and who’ll be using the software day to day. If you’re deep into Microsoft tools, need tight budgets, quick answers via Copilot, and plus straightforward control over data accuracy, then Power BI fits like a glove. On the flip side, go for Tableau if rich visuals matter more, you handle big messy piles of information, you rely on Salesforce, or have experts ready to dive into details. Either one cuts out noise, helping someone spot trends fast, whether it’s a manager typing a casual query or a pro digging through layers. Fit the tool to the humans and systems around it, not some checklist, and suddenly the choice feels obvious, no matter how small or large the business.
FAQ's
Power BI is the better choice for most small businesses due to its affordable pricing, Microsoft integration, and built-in AI features.
Tableau excels in advanced data visualization and exploratory analytics, while Power BI offers stronger Microsoft integration and lower overall costs.
Look for AI-powered insights, interactive dashboards, data visualization, real-time reporting, integrations, and natural language queries.
Yes, AI analytics tools help businesses identify trends, automate reporting, and generate actionable insights from complex data.
Choose an AI analytics platform based on your existing technology stack, reporting needs, budget, data complexity, and team expertise.

The US IoT ecosystem is being fundamentally redefined by the convergence of AI and GPS tracking software, turning passive location data into a powerho [...]
David N. Wilks

The U.S. event management software business is undergoing a seismic upheaval, driven by a post-pandemic explosion in live events and a desire for oper [...]
David N. Wilks

In today's fast-moving, rapidly changing corporate America, the average salesperson spends very little of their week selling and the majority of their [...]